 English

 Slovak
 Czech
Czech
 Hungarian
 Italian
 Polish
 Slovenian





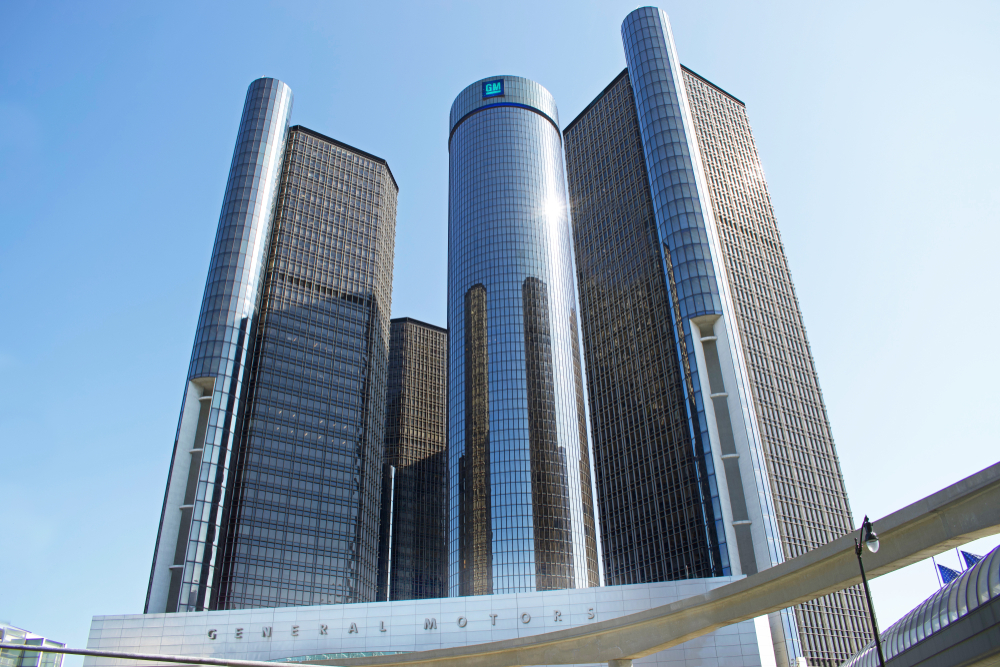
General Motors reported revenue of $48.03 billion in the second quarter of 2026, representing year-over-year growth of 1.9% from $47.12 billion. Revenue growth itself was not dramatic, but the trend in profitability was far more significant. Adjusted EBIT rose from $3.04 billion to $3.94 billion, an increase of approximately 30%. At the same time, the adjusted operating margin improved from 6.4% to 8.2%. The company thus managed to generate significantly higher operating profit even without a significant acceleration in revenue. The results suggest that General Motors managed pricing, its mix of vehicles sold, and its cost structure more effectively.[1]
Adjusted earnings per share reached $3.57, up 41.3% year-over-year and exceeding the analyst consensus, which was around $3.20. On a reported basis, however, the results looked significantly weaker. Net income attributable to shareholders fell by 31% to $1.31 billion and reported earnings per share decreased from $1.91 to $1.41. This discrepancy was not due to a significant deterioration in sales or day-to-day operations, but primarily to one-time costs related to the shift in the electric vehicle strategy. Total adjustments amounted to approximately $2.46 billion. The results should therefore be viewed from two perspectives. The automaker’s core business was stronger than a year ago and exceeded market expectations. However, reported earnings remained burdened by decisions aimed at reducing future costs and aligning production capacity with current demand.1 [1]
North America Remains the Main Source of Profit
Once again, the North American region, which forms the core of General Motors’ profitability, was the most important driver of results. This division’s adjusted EBIT rose 42.7% year-over-year to $3.45 billion, while the operating margin increased from 6.1% to 8.6%. This shift is all the more significant given that the company’s vehicle sales in the United States fell by approximately 4% year-over-year to 715,000 units. The company therefore did not generate higher profits through higher sales volume, but rather through a more favorable mix of vehicles, better pricing, and more efficient cost management. Full-size pickups and SUVs, which are among the most profitable categories in GM’s portfolio, played a significant role. Customers are willing to pay higher prices for these vehicles and often opt for more expensive trim levels, which positively impacts both average revenue and profit per vehicle sold.1
During the quarter, General Motors controlled approximately 43% of the U.S. market for full-size pickups, confirming the strong position of the Chevrolet Silverado and GMC Sierra models. The average transaction price for the company’s vehicles was approximately $52,000. Spending on sales incentives accounted for 4.7% of the suggested retail price, while the average of the automotive industry was approximately 6.3%. The company was thus able to sell vehicles with less discount support than many of its competitors. This is a positive sign, as while excessive incentives may boost sales in the short term, they also reduce margins and can weaken brand value.1
Strong Cash Generation Has Opened the Door to Further Share Buybacks
One of the strongest aspects of the results was cash flow performance. The automotive division’s adjusted free cash flow rose 78% year-over-year to $5.03 billion. Operating cash flow reached $5.07 billion, an increase of approximately 9% year-over-year. Strong cash generation indicates that the growth in adjusted earnings was not merely an accounting result but also translated into real financial resources that the company can use for investments, debt reduction, or shareholder returns. During the quarter, General Motors invested approximately $1.92 billion in production, technology, and other assets. Despite these expenditures, free cash flow remained at a high level, strengthening the company’s financial flexibility at a time when the automotive industry is facing rapid technological and regulatory changes.1
A significant portion of the cash generated was returned to shareholders. During the second quarter, General Motors repurchased approximately $2 billion of its own shares and retired an additional 24.9 million shares. It paid out approximately $200 million in dividends. Buybacks reduce the number of shares outstanding, meaning that future earnings are distributed among a smaller number of shares. This mechanism boosts earnings per share and can create additional value for long-term investors, provided the company purchases its own shares at a reasonable price. The automotive division’s cash balance reached $19.7 billion at the end of the quarter, remaining above management’s long-term target of $18 billion. Thus, even after substantial buybacks, the company maintained a significant liquidity reserve, which provides protection against a potential deterioration in the economic environment.1 [2]
Electric Vehicle Strategy Resulted in Another Billion-Dollar Bill
The biggest negative factor affecting the results was the ongoing costs associated with the electric vehicle strategy. General Motors recorded a charge of approximately $2.28 billion in the second quarter, primarily related to adjustments to production capacity, investment plans, and supplier commitments. In previous years, the automaker had prepared its production for faster growth in demand for electric vehicles than what ultimately materialized in the market.1
Since the second half of 2025, General Motors has reported costs related to the adjustment of its electric vehicle strategy totaling approximately $10.9 billion. Of this amount, about $7.2 billion has a cash impact, and by the end of the second quarter, the company had paid approximately $4.5 billion. Management has indicated that the most significant portion of the expected cash costs associated with the production restructuring should already be behind the company.1 [3]
Higher Outlook Boosts Investor Confidence and Expectations
Following a stronger second quarter, management raised its full-year outlook for adjusted operating profit (EBIT) from the original range of $13.5 billion to $15.5 billion to $14 billion to $16 billion. The forecast for adjusted earnings per share shifted from $11.50 to $13.50 to $12 to $14. General Motors also raised its expected adjusted free cash flow for the automotive division to $9.5 to $11.5 billion. The company continues to expect a North American margin in the 8% to 10% range. The upward revision to the outlook is significant because it indicates that management does not view the strong second quarter as a one-time fluctuation. Management expects that pricing discipline, a favorable product mix, and cost control will continue to support results for the remainder of the year. The higher forecast also creates more room to continue share buybacks and maintain investments in new technologies.1 [4]
However, this more optimistic outlook is accompanied by significant risks. General Motors expects tariffs to reduce full-year profit by approximately $2.5 to $3.5 billion. Higher prices for raw materials, computer chips, and logistics services could create an additional negative impact of $1.5 to $2 billion. The automaker will therefore need to continue reducing production costs while maintaining strong vehicle prices. The scope for further price increases may not be unlimited, especially if consumer demand weakens or competitors increase discounts. The second quarter results confirmed that General Motors’ core business remains in very good shape and is capable of generating high profits and cash flow. At the same time, however, they showed that future performance will depend on whether the company can manage its costly transformation, protect its margins from external pressures, and translate today’s strategic adjustments into more sustainable growth in the coming years.[2] [5]
[1,2,3,4,5] Forward-looking statements are based on assumptions and current expectations, which may be inaccurate, or on the current economic environment, which is subject to change. Such statements are not a guarantee of future performance. They involve risks and other uncertainties that are difficult to predict. Actual results may differ materially from those expressed or implied in any forward-looking statements.
[1] https://investor.gm.com/static-files/4ee9aed7-9a23-46d5-aa6c-093668907497
[2] https://www.reuters.com/business/autos-transportation/gm-quarterly-core-profit-rises-30-truck-suv-strength-2026-07-21/